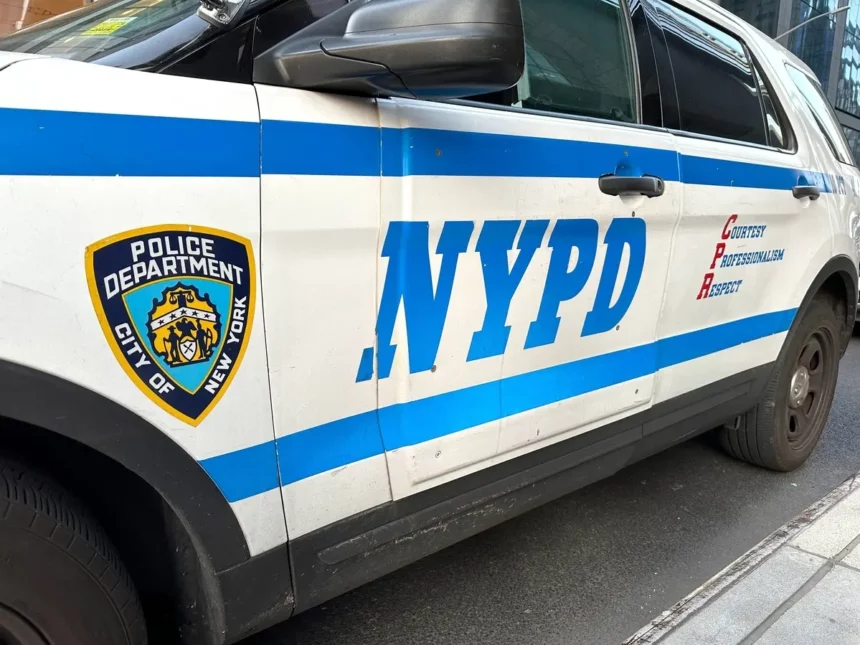
Researchers at Cornell Tech used a deep learning computer model and a dataset consisting of millions of dashboard camera images from New York City rideshare drivers to determine which neighborhoods had the highest concentrations of NYPD marked vehicles.
Their findings revealed patterns in police activity across time of day, neighborhood type, distance from police stations, and proximity to business districts.
The study found that there were nearly 20 times as many police vehicles in Gramercy Park, in midtown Manhattan, as there were in Arden Heights/Rossville, in southern Staten Island. Rich commercial districts and low-income areas with a disproportionate number of Black and Latino residents were both disproportionately represented in images of police vehicles.
The study was presented on June 12 at the Association for Computing Machinery Conference on Fairness, Accountability, and Transparency (FAccT ’23) in Chicago.
Researchers trained a deep learning model to recognize marked police vehicles using thousands of images. The model recognized police cars, but it couldn’t explain why they were in the area. Police departments routinely refuse to release information on how and where officers are deployed, citing security concerns, even though data on stops, use of force, searches, criminal incidents, and arrests is available to the public.
Nexar, a company that supplies dashboard cameras to rideshare drivers, provided the team with 24.8 million images in 2020.
Over 233,000 images of police vehicles were identified by the researchers. The geotagged photographs were then analyzed in relation to factors such as where they were taken (residential, commercial, industrial) and the demographics of the surrounding area. They compared the images to local census data as well.
The study’s authors highlight two major outcomes: (1) a move toward greater police transparency, and (2) the possibility of expanding auditing to include all government agencies to ensure efficiency and equity.
You can read the findings by clicking here.


